EmeraldHike
Member
- Joined
- May 10, 2021
- Messages
- 133
- Reaction Score
- 0
- Points
- 21
- #1
Histograms are immensely helpful tools when it comes to editing photographs, but I have to say, while they look very cool to have hanging around our cameras and editing applications, they’re also one of the most ignored features out there. Personally, I feel very professional when a histogram is in view. Do I use it all the time? Sadly, I don’t. I’ve been doing this for so long now that I’ve got a feel for certain things. Histograms are definitely important though, especially for newcomers in this game. They can offer tons of useful information and they shouldn’t be ignored at all. Sometimes your eyes can fool you as you’re viewing a scene or an image. Histograms don’t fool you. We should all be using them much more often.
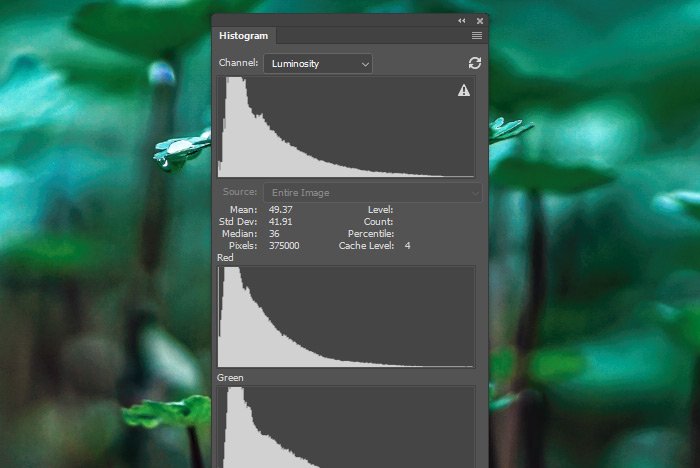
What is a histogram? It’s basically a tool that measures exposure in an image. I’ll leave it at that. As I continue to write this post down below, you’ll learn much more about these little treasures. What does a histogram look like? Here’s one for you. It’s from Adobe Photoshop.
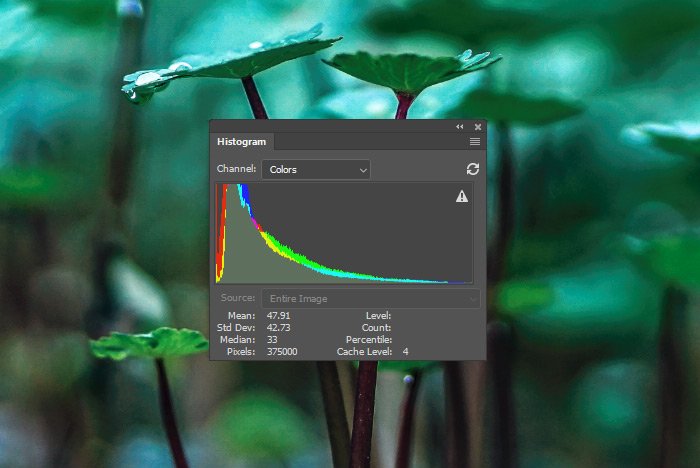
I opened this Histogram panel by going to the Window > Histogram menu item and clicking. When it opened, it was stuck to the toolbar on the right. To separate it from the toolbar, I simply clicked on the top part of it and dragged it away. Now it’s sitting in the middle of my screen.
In today’s post, I’d like to do some exploration around the Histogram panel as well as explore how this tool can help when it comes to analyzing and editing photos and graphics. While this tool may seem intimidating at the beginning, once you understand exactly what it’s here for, it won’t be intimidating at all. It’s actually quite friendly.
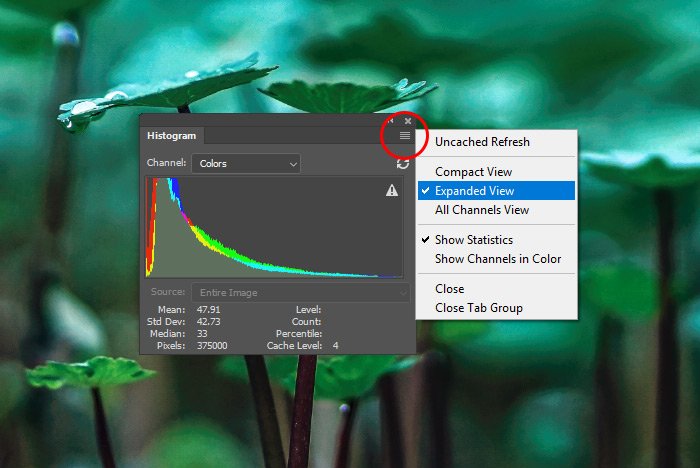
As you can see, I’m currently in the Expanded View, which offers a few handy statistics below the graph. There’s also the Compact View, which is smaller and which doesn’t show any statistics. There’s also the All Channels View, which shows not only the RGB histogram, but individual histograms for the Red, Green and Blue channels.
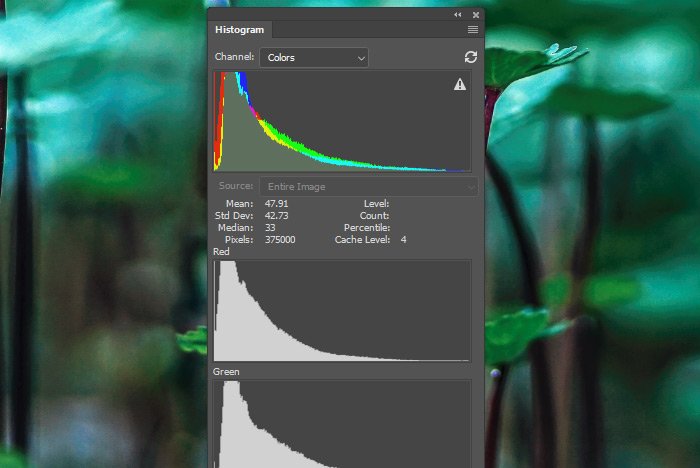
This All Channels View can come in handy when you’d like to analyze and edit specific colors in the image you’re working on.
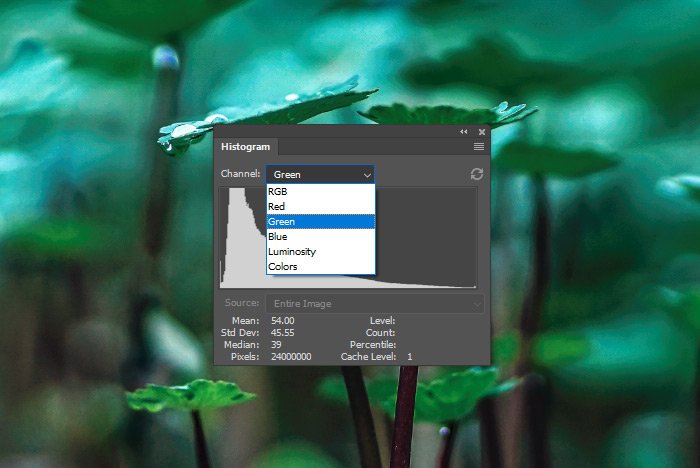
Currently, we’ve got RGB, Red, Green, Blue, Luminosity and Color options available. If I click on any one of these choices, I’ll see the histogram change in shape. Since the image I’m using as an example in this post is fairly uniform and dark in color, I’m not seeing large swings in the curve, but if I was using a different image that had many varying colors in it, I’d see much more of a difference among options.
If I select the RGB option from the drop-down, I’ll see all of the colors merged into one curve. I won’t be able to distinguish between any color’s curve in the image. If I choose either the Red, Green or Blue options, I’ll get a curve that separates out that specific color. If I choose the Luminosity option, I’ll see a histogram that represents the luminance values of the three channels combined. And finally, if I select the Color option, I’ll see each individual histogram for the red, green and blue colors overlay one another. It’s basically a composite of the three, but the individual colors are visible and easily distinguished. Personally, I like to use the Luminosity option to check the image’s overall exposure value. After all, that’s the primary use for this tool.
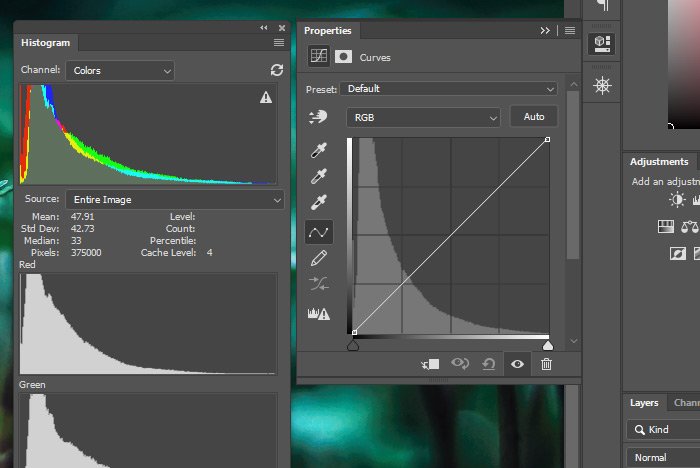
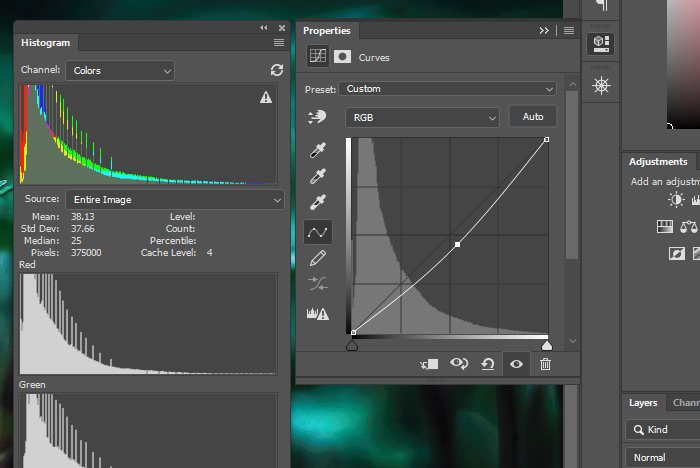
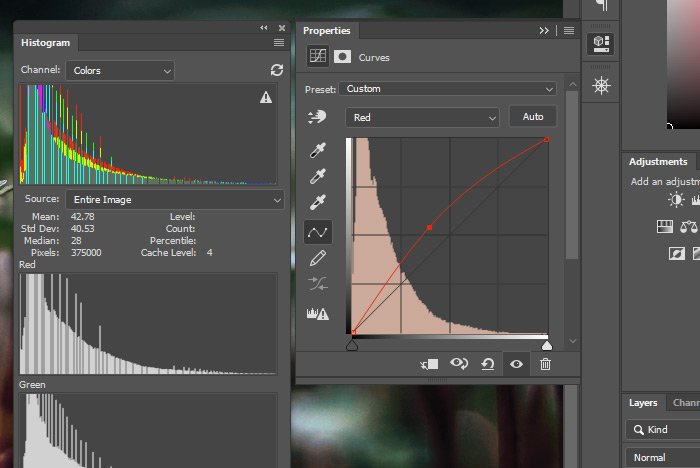
Now, if I wanted to adjust the luminance of just one channel and see if it’s making a difference in that particular luminosity histogram, I could easily add a Levels adjustment layer to the image from the Adjustments panel and then set the value to Red, if that was, for example, the color I’m interested in altering. Take a look. This next screenshot is of just the histogram I previously showed you above sitting to the left of the Levels adjustment layer Properties panel. Notice how I’ve set the Levels drop-down to Red.
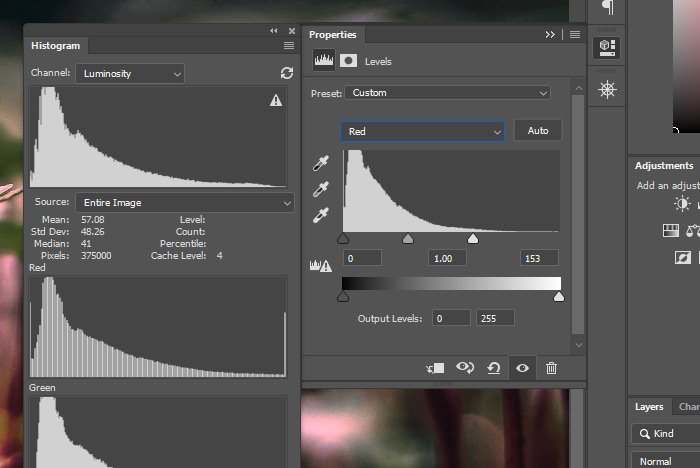
I also went ahead and pushed the right handle in the Levels adjustment layer Properties panel to the left, which brought out a lot more red in the image. As I did this, I watched the Red curve in the Histogram panel move in conjunction with the changes I was making. It’s all very interesting and rather helpful. It’s a granular approach to editing photographs.
As you can see, the Histogram panel inside of Adobe Photoshop can offer tons of valuable information. When combined with other tools in Photoshop, it can be a handy guide that can assist with properly editing a photograph or graphic. If you have any questions regarding this tool or specific panel, please let me know in the comment section below or in the Photoshop discussion forum. Thanks for reading!
What is a histogram? It’s basically a tool that measures exposure in an image. I’ll leave it at that. As I continue to write this post down below, you’ll learn much more about these little treasures. What does a histogram look like? Here’s one for you. It’s from Adobe Photoshop.

I opened this Histogram panel by going to the Window > Histogram menu item and clicking. When it opened, it was stuck to the toolbar on the right. To separate it from the toolbar, I simply clicked on the top part of it and dragged it away. Now it’s sitting in the middle of my screen.
In today’s post, I’d like to do some exploration around the Histogram panel as well as explore how this tool can help when it comes to analyzing and editing photos and graphics. While this tool may seem intimidating at the beginning, once you understand exactly what it’s here for, it won’t be intimidating at all. It’s actually quite friendly.
The Different Views of the Histogram
In the upper right corner of the panel, there’s a menu. If I click on that menu, I’ll see a few different options that pertain to how the panel is presented in Photoshop.
As you can see, I’m currently in the Expanded View, which offers a few handy statistics below the graph. There’s also the Compact View, which is smaller and which doesn’t show any statistics. There’s also the All Channels View, which shows not only the RGB histogram, but individual histograms for the Red, Green and Blue channels.

This All Channels View can come in handy when you’d like to analyze and edit specific colors in the image you’re working on.
Regenerating the Histogram
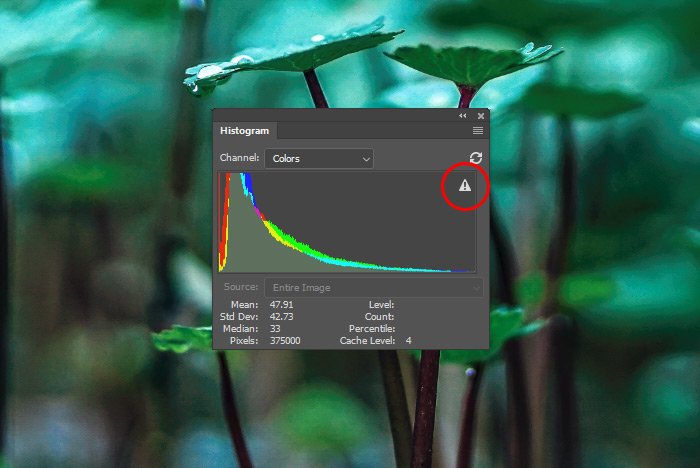
As you work in Photoshop, data becomes cached in its memory. Because of this, the histogram you’re currently viewing may not be populated with the most up to date information. If you see a small triangle with an exclamation mark inside of it and roll over that warning symbol, you’ll see this text appear: Click for Histogram with Uncached Data. If you click that warning icon, the histogram will regenerate itself and will be once again populated with unchached, recent information.
Viewing a Histogram For Each Color
At the top of the Expanded View histogram is the Channel drop-down box. If I click that box, I’ll see a few different options. In this section, I’d like to briefly address a few of the options available in this drop-down.
Currently, we’ve got RGB, Red, Green, Blue, Luminosity and Color options available. If I click on any one of these choices, I’ll see the histogram change in shape. Since the image I’m using as an example in this post is fairly uniform and dark in color, I’m not seeing large swings in the curve, but if I was using a different image that had many varying colors in it, I’d see much more of a difference among options.
If I select the RGB option from the drop-down, I’ll see all of the colors merged into one curve. I won’t be able to distinguish between any color’s curve in the image. If I choose either the Red, Green or Blue options, I’ll get a curve that separates out that specific color. If I choose the Luminosity option, I’ll see a histogram that represents the luminance values of the three channels combined. And finally, if I select the Color option, I’ll see each individual histogram for the red, green and blue colors overlay one another. It’s basically a composite of the three, but the individual colors are visible and easily distinguished. Personally, I like to use the Luminosity option to check the image’s overall exposure value. After all, that’s the primary use for this tool.
Viewing Luminosity For Individual Color Channels
This is where things start to get interesting. Let’s say that I have an image that’s overexposed in a certain area, but I’m not sure where that area is. My guess is that it’s in one of the colors and I’d like to find out which one. To view each individual channel’s luminance values, I’ll change the Histogram panel’s view to All Channels View and then I’ll select Luminosity from the Channels drop-down. Here’s a trimmed screenshot of this setup.
Now, if I wanted to adjust the luminance of just one channel and see if it’s making a difference in that particular luminosity histogram, I could easily add a Levels adjustment layer to the image from the Adjustments panel and then set the value to Red, if that was, for example, the color I’m interested in altering. Take a look. This next screenshot is of just the histogram I previously showed you above sitting to the left of the Levels adjustment layer Properties panel. Notice how I’ve set the Levels drop-down to Red.

I also went ahead and pushed the right handle in the Levels adjustment layer Properties panel to the left, which brought out a lot more red in the image. As I did this, I watched the Red curve in the Histogram panel move in conjunction with the changes I was making. It’s all very interesting and rather helpful. It’s a granular approach to editing photographs.
As you can see, the Histogram panel inside of Adobe Photoshop can offer tons of valuable information. When combined with other tools in Photoshop, it can be a handy guide that can assist with properly editing a photograph or graphic. If you have any questions regarding this tool or specific panel, please let me know in the comment section below or in the Photoshop discussion forum. Thanks for reading!

