JodyBuchanan
Member
- Joined
- May 10, 2021
- Messages
- 138
- Reaction Score
- 0
- Points
- 21
- #1
There's a lot of guesswork when it comes to making an investment in the stock market. Most of us just close our eyes and buy something. It's almost a dizzying process in which we attempt to make sense of our goals and then to align them with safe and well performing assets. The bottom line is that a good majority of us know nothing about what we should do and what will lead us to a happy ending. Such is the financial sales industry. The good news is that, if we stick to it, somewhere in our 40s we'll figure things out and will calm down enough to buy and hold. You know, buy for the long haul. Like we should have been doing since our 20s.
Can you imagine how things would be if you had actually held on to that stock or ETF you bought way back when? I'm willing to say that if you had, you'd have a lot more worth right now. There have been so many investments that I've sold through the years that I wish I hadn't. I was too eager though. I got in my own way. I knew best. I screwed up.
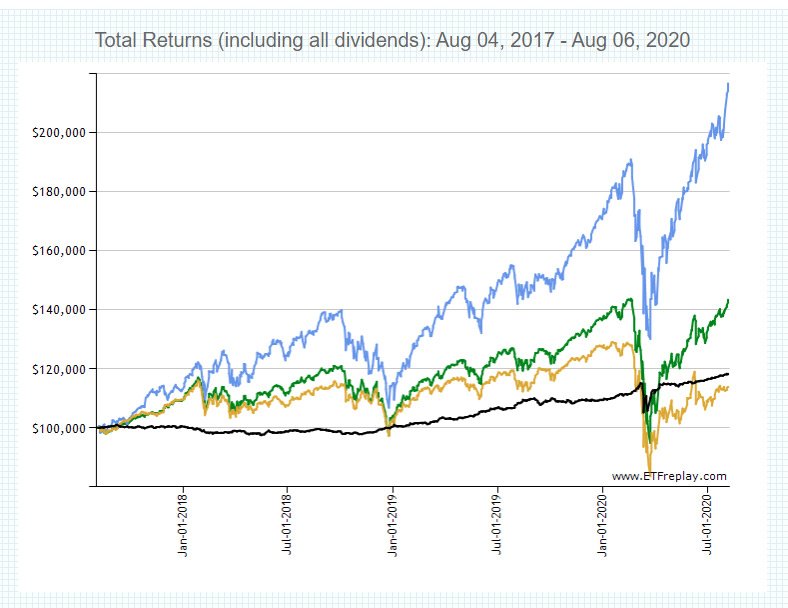
One tool I wish I had was a historical ETF and stock comparison tool. If there was a way for me to plug some ticker symbols in as well as a time horizon to see what the values of things were back a few years ago compared to today, yeah, that would have helped tremendously. We read so much commentary about how certain investments have performed through the years. It's mostly a bunch of BS. How's this - give me the ticker symbol and I'll plug it into my way back machine and I'll take a look at the chart of performance myself. That way, I don't need to listen to any sales pitch from some guy who's trying to make money off me. Check this out:
This is a comparison of total return performance starting in August of 2017 through August of 2020 (thumbnail below). The ETFs I chose to compare are:
Blue: VGT
Green: VOO
Gold: VYM
Black: BND
All great ETFs. And by the way, total return means that dividends have been taken into account and those dividends have been reinvested. If I had gone further back in time, the lines would have smoothed out somewhat. It's not like VYM got this hammered compared to VGT, but I will say that VGT is kicking butt right about now. That's the Vanguard Tech ETF. Everyone wants into that one right now. That's obvious.
The website I used for this performance comparison is called ETF Replay. It's very cool. If you're reading this post right now and you're saying to yourself, "Man, I would love to check out some ETFs I used to own. I'd like to see how they're doing today against some I think I should have purchased." Well, this is your new toy. Bookmark the page and go back to it often. I can tell you that I use this tool quite a bit and it's truly shed some light on many an ETF. Let me know what you think.

